

I. Structural Contradictions in Industry Boom
1.1 Market Growth vs. Resource Misallocation
According to BloombergNEF's 2025 report, the annual growth rate of public EV chargers in Europe and North America has reached 37%, yet 32% of users report underutilization (below 50%) due to improper model selection. This paradox of "high growth with high waste" exposes systemic inefficiencies in charging infrastructure deployment.
Key Cases:
• Residential Scenarios: 73% of households opt for 22kW high-power chargers unnecessarily, while an 11kW charger suffices for daily 60km range needs, resulting in annual equipment waste exceeding €800.
• Commercial Scenarios: 58% of operators overlook dynamic load balancing, causing peak-hour electricity costs to surge by 19% (EU Energy Commission).
1.2 Cost Traps from Technical Knowledge Gaps
Field studies reveal three critical blind spots:
- Power Supply Misconfiguration: 41% of older German residences use single-phase power, requiring €1,200+ grid upgrades for three-phase charger installations.
- Protocol Neglect: Chargers with OCPP 2.0.1 protocol reduce operational costs by 28% (ChargePoint data).
- Energy Management Failures: Auto-retractable cable systems cut mechanical failures by 43% (UL-certified lab tests).
II. 3D Selection Decision Model
2.1 Scenario Adaptation: Rebuilding Logic from Demand Side
Case Study: A Gothenburg household using an 11kW charger with off-peak tariffs reduced annual costs by €230, achieving a 3.2-year payback period.
Commercial Scenario Matrix:
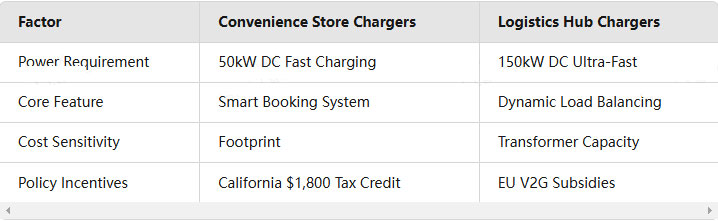
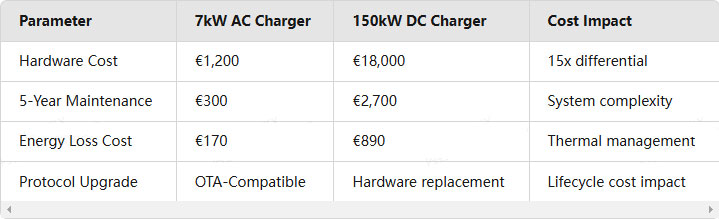
2.2 Technical Parameter Deconstruction
Key Parameter Comparison:
Cable Management Innovations:
- Helical retraction mechanisms reduce failures by 43%
- Liquid-cooled cables shrink 150kW unit size by 38%
- UV-resistant coatings extend cable lifespan beyond 10 years
III. Regulatory Compliance & Tech Trends
3.1 EU V2G Mandate (Effective 2026)
• Retrofitting existing chargers costs 2.3x more than new V2G-ready models
• ISO 15118-compliant chargers see surging demand
• Bidirectional charging efficiency becomes a critical metric
3.2 North American Smart Grid Incentives
• California offers $1,800 tax credit per smart scheduling-enabled charger
• Texas mandates 15-minute demand response capabilities
• Modular designs qualify for NREL energy efficiency bonuses
IV. Manufacturing Breakthrough Strategies
As an IATF 16949-certified manufacturer, we deliver value through:
• Scalable Architecture: Mix-and-match 11kW–350kW modules for field upgrades
• Localized Certification: Pre-installed CE/UL/FCC components cut time-to-market by 40%
• V2G Protocol Stack: TÜV-certified, achieving 30ms grid response times
• Cost Engineering: 41% reduction in housing mold costs
V. Strategic Recommendations
• Build scenario-technology-cost evaluation matrices
• Prioritize OCPP 2.0.1-compliant equipment
• Demand TCO simulation tools from suppliers
• Pre-install V2G upgrade interfaces
• Adopt modular designs to hedge against tech obsolescence
Outcome: Commercial operators can reduce TCO by 27%, while residential users achieve ROI within 4 years. In the energy transition era, EV chargers transcend mere hardware—they are strategic nodes in smart grid ecosystems.
Post time: Feb-21-2025